
Energy Dashboard
⚡ Emporia Energy Meter Access
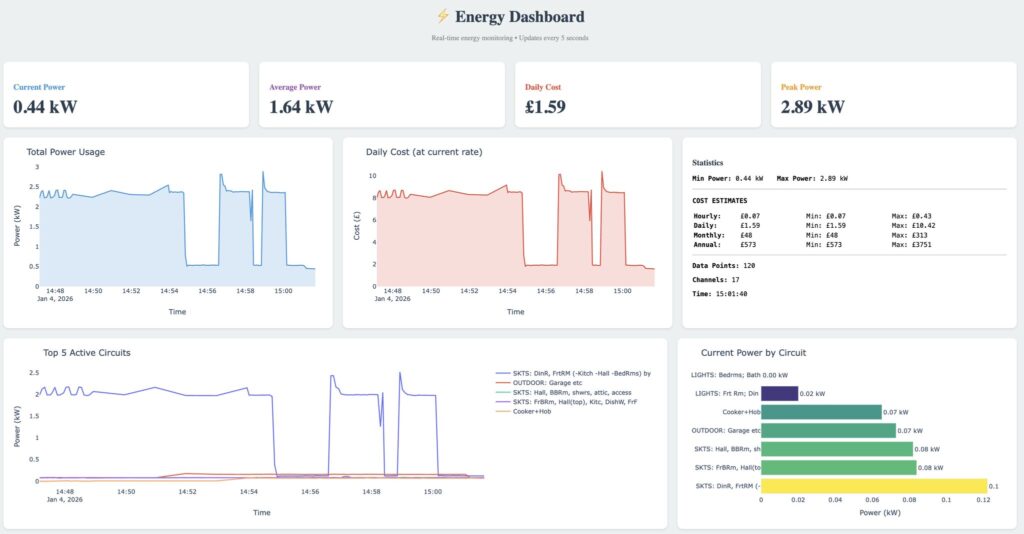
A practical energy-monitoring application that connects to an Emporia Vue system and retrieves real-time and historical electricity usage data through a set of dashboards and command-line tools. It makes it easier to track household or circuit-level consumption, estimate costs, export usage records to CSV, and view live information across desktop, tablet, and compact touchscreen displays.
Designed for day-to-day monitoring and analysis, the project supports multiple viewing formats including full desktop dashboards, tablet-friendly layouts, and compact touchscreen interfaces for Raspberry Pi-style displays. Its flexible workflow makes it a useful project for demonstrating how real-time API data, interactive visualisation, and cross-device monitoring can be combined in one practical system.
Matching sections
✨ Key Features
- Retrieves real-time energy usage data with frequent updates.
- Displays live information through interactive web dashboards.
- Supports desktop, tablet, phone, and compact touchscreen viewing.
- Exports historical usage data to CSV for further analysis.
- Estimates electricity costs using configurable rates.
- Monitors multiple circuits and connected devices from one interface.
🔍 How It Works
The application authenticates with the Emporia system, retrieves live and historical usage data, and presents the results through dashboards or command-line tools depending on the device and use case. It was built in Python using an unofficial Emporia interface, with Plotly Dash dashboards for visualisation and supporting scripts for monitoring, exporting, and device discovery.
🎯 Practical Uses
This project is useful for household energy monitoring, appliance tracking, cost awareness, historical consumption analysis, and wall-mounted live displays. It is a clear example of how API integration, time-series monitoring, and responsive dashboard design can be combined in a practical IoT-focused application